Understand the digital landscape
Get daily Amazon sales for you and your competitors. Report on category share and understand what sales are for 1P versus 3P sellers on Amazon marketplace.


"We switched to Profitero for the accuracy of their Amazon Sales & Share data, the easy-to-use and intuitive interface and their experience as a trusted partner to accelerate growth."

Get daily Amazon sales for you and your competitors. Report on category share and understand what sales are for 1P versus 3P sellers on Amazon marketplace.


Track Traffic & Conversion analytics to understand how shifts in demand affect your product portfolio, and what specific products to focus on to impact sales performance.
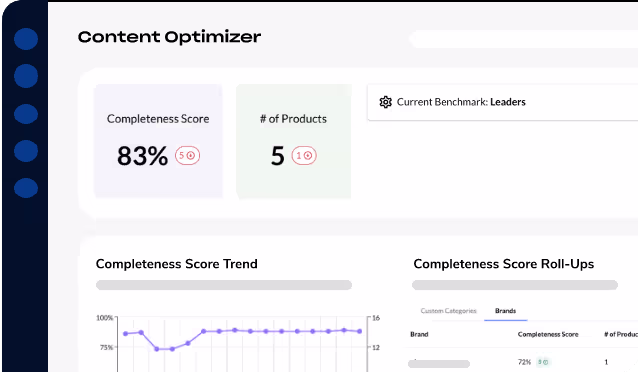
Get estimates for ROI, of improving digital shelf levers such as Content and Search. Stay two steps ahead of competitors with bespoke, ASIN-level recommendations aligned to your product categories and those of Nielsen and Circana.

Measure sales losses to 3P sellers and pinpoint specific competitors to take actions against.
Get accurate brand and category data with ASIN-level insights collected multiple times a day to track market share and capture of demand signals.
Rely on industry verified data accuracy with methodologies that calibrate for ARA anomalies, peak periods and product variants for greater stability — a glass box, not a black box.

Access a globally scalable solution that combines share, operations 3P and digital shelf insights across all major markets in one platform.


Drive retailer action and strategies with competitive knowledge.
Discover how AMZ Vendor Health helps you unlock profitability on Amazon.

Align growth priorities with market performance.

Guide smarter decisions on Amazon.

Optimize for what is converting.


.png)