Menu

One of the best parts about working at Profitero is the ability to have my hands on so much great eCommerce data. But what’s even better is being able to share it with our customers so they can unlock more growth opportunities and budget.
(You could say it makes me feel a little bit like Ol’ Saint Nick.)
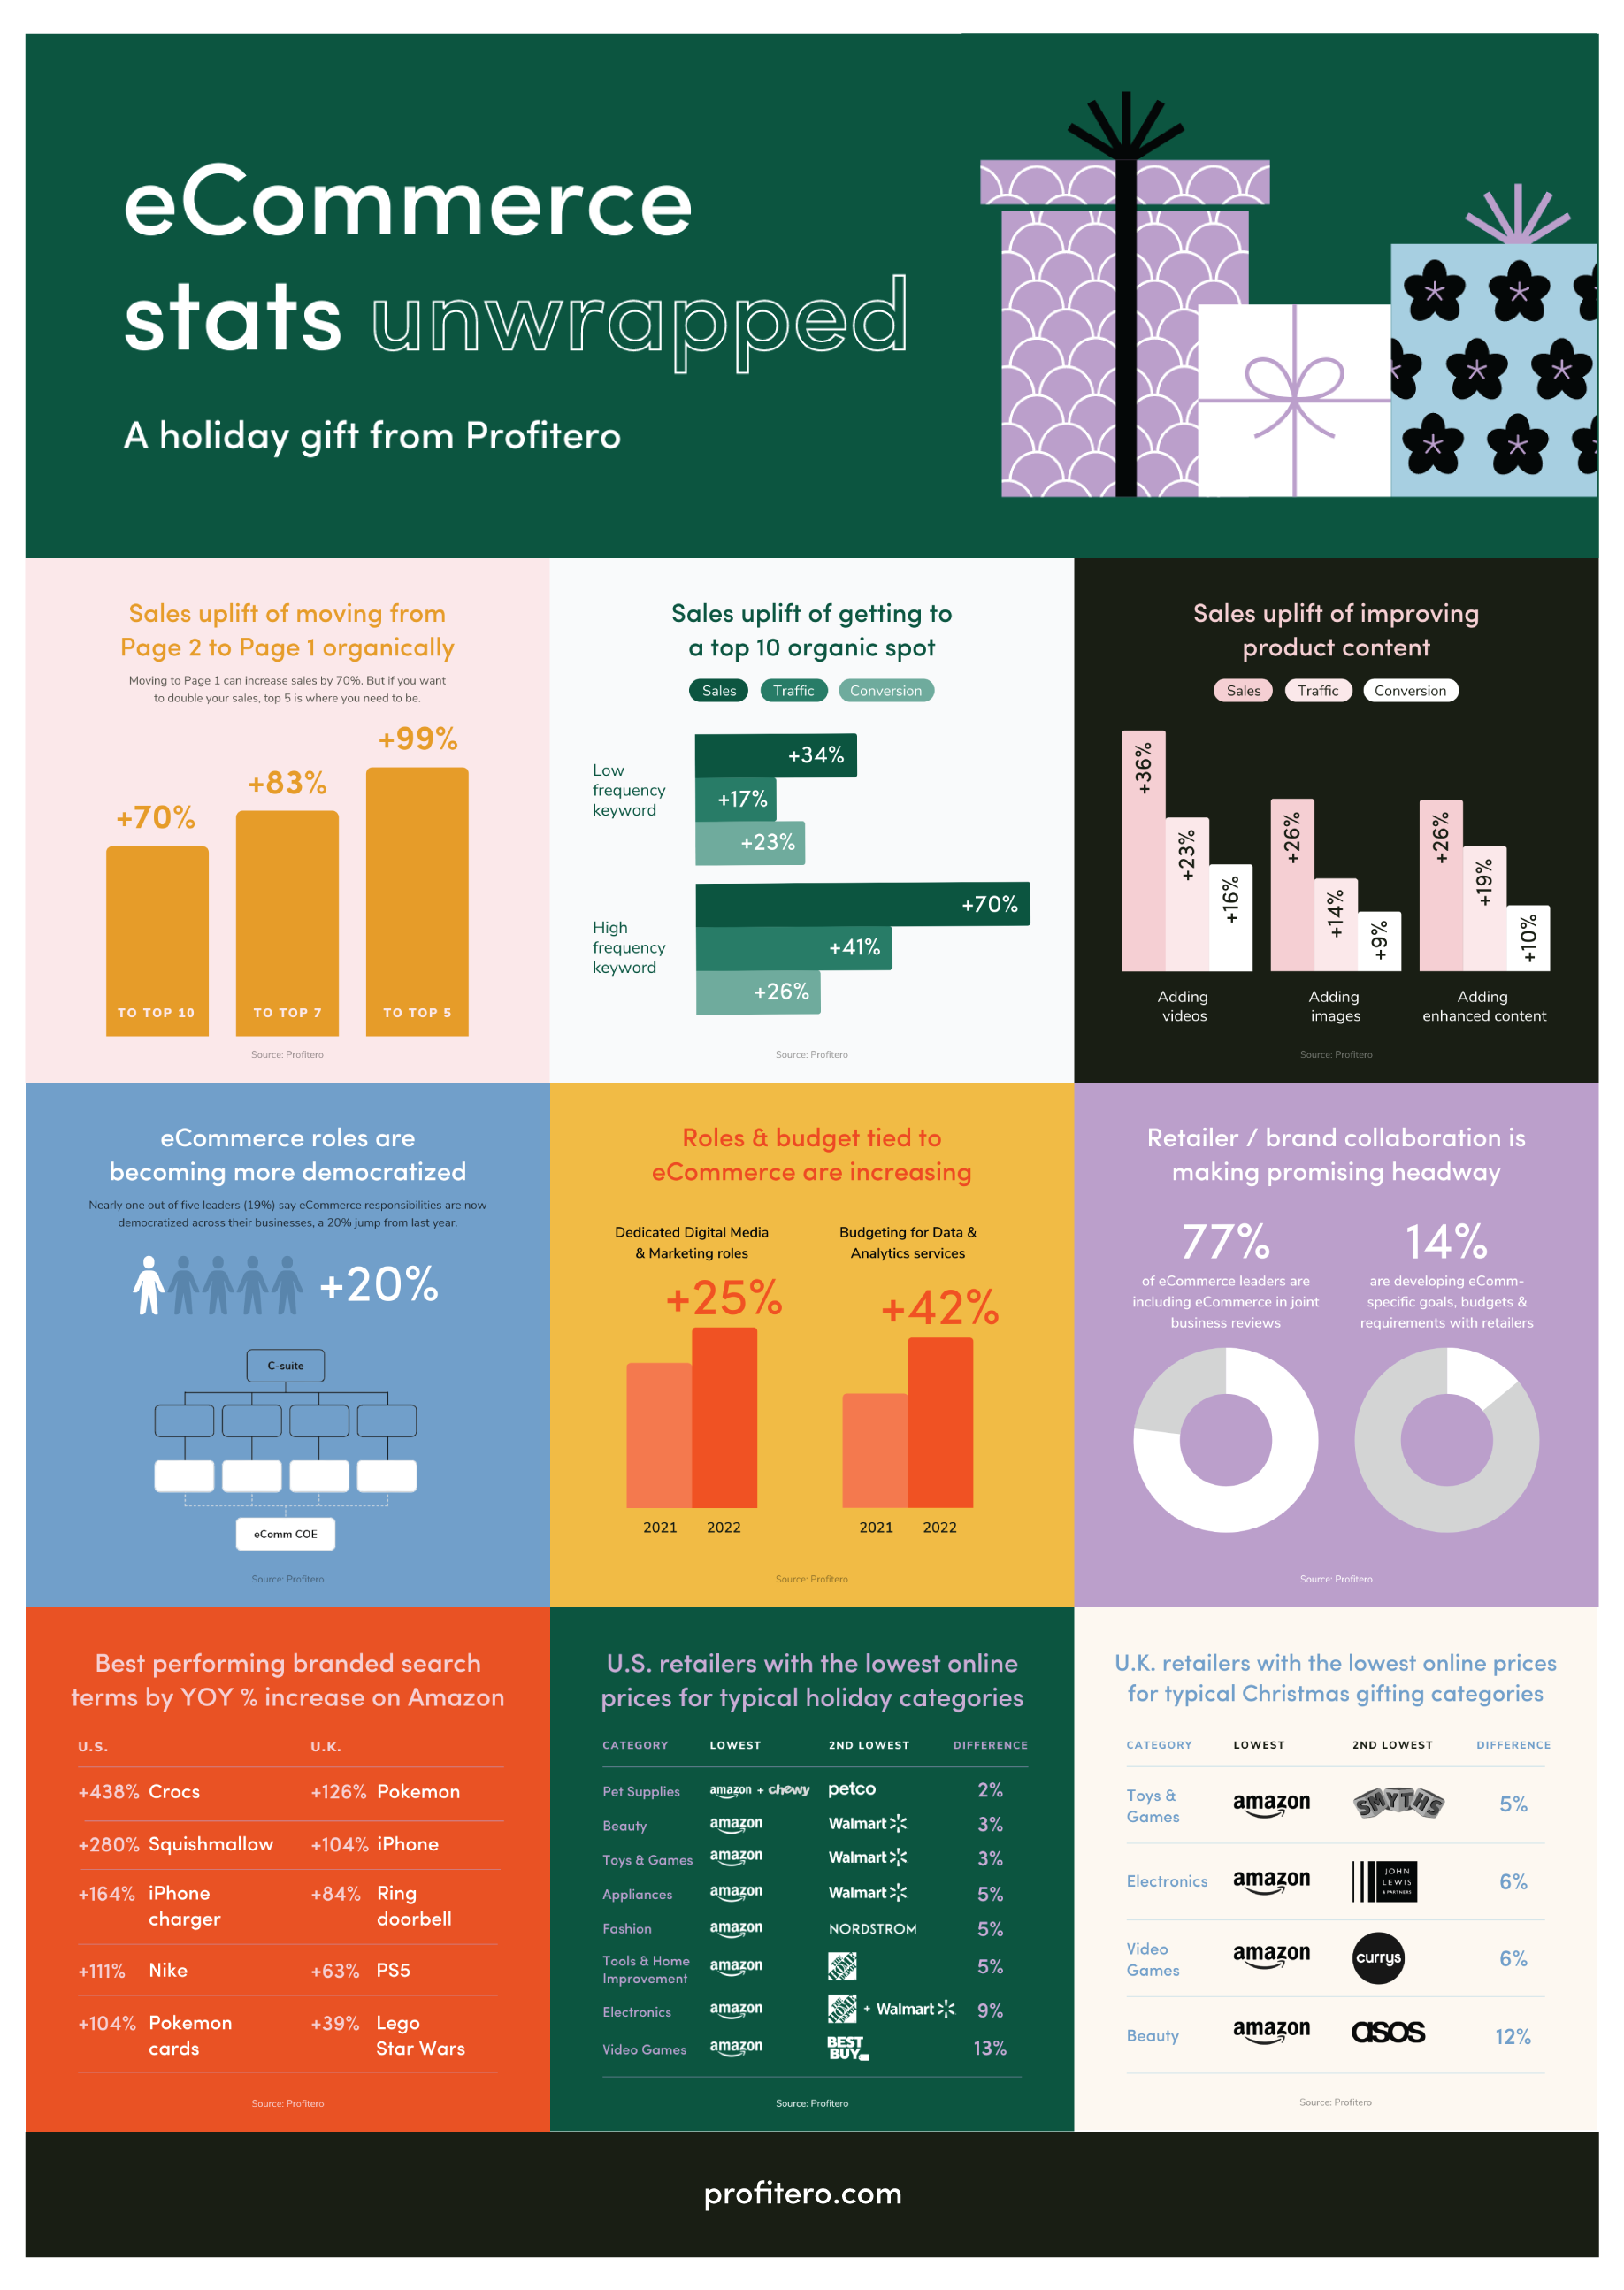
To that end, I'm pleased to present eCommerce Stats Unwrapped — a visual recap of our top stats from 2022.
In the infographic below, you'll see that brands can effectively increase sales 2x by "organically" getting products to the top of page 1 of retailer search results. ("organically" means they are not buying ads to get there, but rather "earning" their way through a combination of search optimized content and highly relevant products). On top of this, brands can also grow their sales by as much as 36% by enhancing their product pages with videos and images.
This is critical for two reasons:
(If you’re looking to understand HOW you can get to Page 1, check out our decoding retailer search algorithms research.)
In our annual eCommerce benchmarking study, we found a dramatic increase in the number of brands who said they were 'democratizing' eCommerce across their business — a 20% jump from 2021. This means that organizations are no longer solely operating with eCommerce Centers of Excellence as isolated teams, but rather embedding eCommerce experts, data and best practices in commercial teams (like the Walmart team) and even in areas of functional speciality (like marketing and supply chain). Rather than being seen as a separate channel, eCommerce is now seen as a core enabler of all retail business. And this is leading to eCommerce taking a more central part of retailer joint business reviews and receiving more investment, as the charts show.
Our annual Price Wars study analyzes online price competition amongst online retailers in the U.S. and the UK. Amazon's aggressive price discounting will put downward pressure on all retailers to follow. This is great news for consumers but for brands it means increased pressure on margins. More than ever brands need to differentiate their assortment and use digital shelf analytics to pay close attention to changes in price and MAP violations.
Hopefully, these stats can give you a little ammunition to bring into your next meeting. We look forward to sharing more new and exciting data in 2023.
Happy Holidays!
Placement research approach and sample
Using our daily item-level view of Amazon sales, traffic & conversion and search placement data, Profitero studied the impact of more than 16k unique placement performance changes, spanning 4k+ products in multiple categories across Amazon.com & Amazon.co.uk. Data was collected between Jul 1, 2022 and Sep 30, 2022 and excludes Prime Day (July 12-13). This analysis primarily focuses on products moving onto or up page 1 organically, controlling to exclude sponsored placement. The sales uplift is calculated using the first party unit sales and we control for many external factors including promotions, availability and 1P winning the Buy Box.
Content research approach and sample
Using our daily item-level view of Amazon sales, traffic & conversion, and search placement data, Profitero studied the impact of more than 8.5k unique PDP changes, spanning 4k+ products in multiple categories across Amazon.com & Amazon.co.uk. Data was collected between Aug 1, 2022 and Oct 31, 2022. This analysis primarily focuses on products changing their product content related to the number of images, videos or Enhanced/A+ content. The sales uplift is calculated using the first-party unit sales. The sales uplift is calculated using the first-party unit sales and we control for many external factors including promotions, availability and 1P winning the Buy Box.
Search trend research approach
Search terms are selected based on their average weekly Amazon Search Frequency Rank between the week ending Jan 8th, 2022 and Nov 26th, 2022. To qualify, they must have stayed within the top 250 search terms throughout the analysis period. Search terms were excluded if a similar branded term had already featured within the relevant top 5 list. The best-performing terms are chosen according to the % change in rank for the week ending Nov 26th, 2022 compared to the same week last year.