


This is the final post of a five-part blog series that has covered highlights, key features, and use cases of Profitero’s Amazon FastMovers reports: If you’ve missed any of our earlier posts, you can catch up on the series so far:
- Part 1: How to Analyze your Competitors
- Part 2: Identifying New Arrivals in your Category
- Part 3: Detecting Consumer and Product Trends
- Part 4: Tracking the Number of 3P Sellers
This fifth post examines ways to benchmark your products using Amazon FastMovers reports, helping you to understand how your product and brand stacks up against other best sellers on Amazon.
Amazon FastMovers – Executive Summary
Every Amazon FastMovers report provides an executive summary, which gives a high-level overview of a specific category. Below is an example for the Amazon US Baby Category for December 2016.
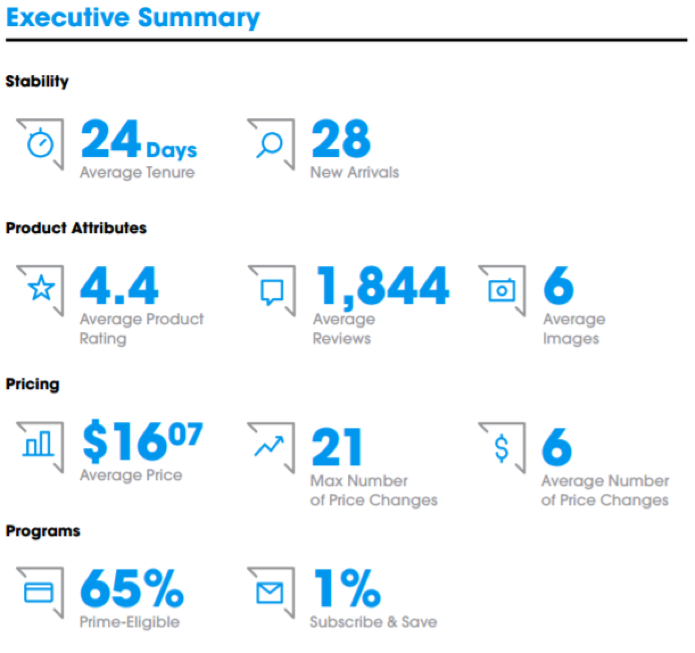
The breakdown of Product Attributes, Pricing, and Programs, makes it easy for any brand or product to benchmark themselves within that category.
Product Attributes
The Product Attributes section defines characteristics of a product’s performance on Amazon and is divided into three areas:
Average Product Rating:
The Product Ratings section is derived and pulled directly from Amazon’s 5-star rating scale at the product level. Each product is rated using their suggested guidelines.
- 1 star: I hate it
- 2 stars: I don’t like it
- 3 stars: It’s ok
- 4 stars: I like it
- 5 stars: I love it
Each product for sale on Amazon has a star rating attached to it, enabling you to gauge that product’s reputation versus the category average.

When we looked at our FastMovers reports, which can be found here, products on Amazon US had an average star rating across all categories of 4.4 in December 2016, while products on Amazon UK had an average star rating of 4.5.
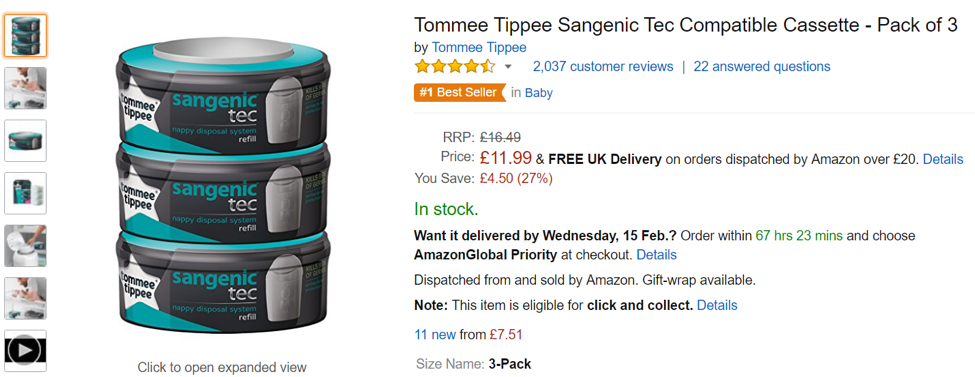
It also comes as no surprise that the leaders on Amazon’s best-selling lists are usually those that carry a high star rating. For example, in the UK Baby category for December 2016, the number one best-selling product Tommee Tippee Sangenic Tec Compatible Cassette – Pack of 3 had an average star rating of 4.6 compared to the category average of 4.4.
Average Reviews:
A high product rating is clearly a good sign for a product, but the number of reviews gives that rating further merit. Together, these two attributes often have a direct correlation on a product’s increased sales.
The average number of reviews also helps you determine a reasonable number of reviews to expect for a product in your category, and by country. If you do not have a threshold for the number of reviews your product should be receiving you might end up completely missing the mark.
Here is a breakdown of the number of reviews by category on Amazon.com and Amazon UK, with the number of reviews in the Electronics category in both markets winning by a wide margin:
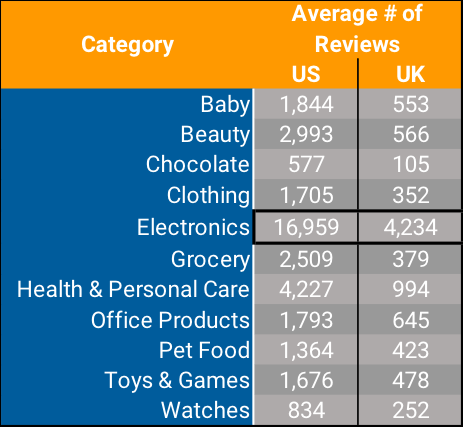
Source: Profitero’s Amazon FastMovers reports, December 2016
The US Toys & Games Category had an average of 1,676 reviews per product in December 2016. However, in that same month the US Electronics Category had an average of 16,959 reviews per product. Without this benchmark, you might be completely under-performing on the number of product reviews, compared to your specific category.
Increasing the number of reviews for your product helps drives a product’s popularity. Consumers are in tune with reviews left by their co-consumers, leading many to make purchases based on those reviews, and number of reviews.
Average Images:
Product content is essentially your product’s packaging at the digital shelf. Ensuring you have an adequate number of images to accompany your product is vital to give your brand the best chance of maximizing conversion on Amazon.
Again, looking at the core categories Profitero covers, the US had an average of 6 images across categories in December 2016, and the UK had an average of 4 images. Based on this reasoning, it would be optimum to have 6 images per product in the US and 4 images per product in the UK.
Images help consumers interact with your product more effectively – saving them time and helping them make a better decision on the item they are about to purchase.
Pricing
Product pricing has the ability to make or break the success of your product on the digital shelf. Price a product too high and it might not sell. Price a product too low and you could have problems with the product being out of stock. Benchmarking your product’s price to those that are in the same category could help with your pricing strategy.
Average Price:
The average price of the category includes all 100 best-selling products in that category. Here is a breakdown of the average price by category on Amazon.com and Amazon UK in June and December of 2016:
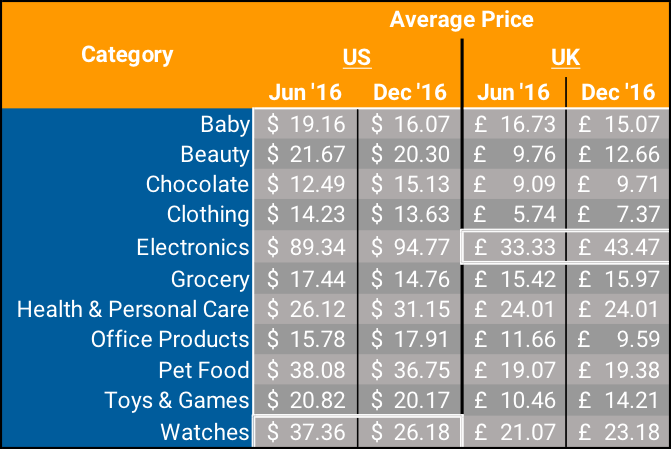
Source: Profitero’s Amazon FastMovers reports, June and December 2016
Looking at specific categories over time helps identify price volatility due to a monthly and seasonal basis. For example, the difference between the US Watches category from June to December has an $11.18 price difference on average. In the UK, the Electronics category has a £10.14 price difference. Staying up to date on a monthly basis will help with monitoring price trends in a specific category.
Subscribe to Amazon FastMovers Reports
Profitero’s FastMovers reports analyze best-selling Amazon products to produce a cumulative ranking by category, delivered directly to your inbox on a monthly basis. These complimentary product performance reports are available for Amazon US (12 Categories), Amazon UK (11 Categories), and Amazon France (5 Categories).
However, these reports are just the tip of the iceberg for monitoring a product’s performance on Amazon.
Profitero’s Digital Shelf 360 product suite provides a holistic view of your eCommerce performance across many different retailers and countries. Analysis at the product level for product content, placement, pricing, rating & reviews, and assortment, coupled with insights from our expert analyst team, is the next step to help you win the eCommerce race.
Request a demo today to understand the full capability of Profitero’s Digital Shelf 360 solution.