


Here’s some news that isn’t earth shattering: eCommerce teams want to uncover insights and make conclusions, fast. The freedom to visualize, analyze and combine multiple data sources lets you look at your data in new ways, come to conclusions and take action. But even with the help of software partners, automation techniques, consultants and agencies – only you are accountable for the decisions made for your business.
A checklist for getting started
Combining data sources can be tricky. Data from different sources may be available at different levels of granularity (e.g. product-level versus brand-level). Reporting periods may not perfectly align. Brand and category hierarchies may be defined based on different inclusion or exclusion criteria. Common unique identifiers to append one dataset to another may not be readily available.
Ultimately, you want to make sure that your conclusions are not misleading and have a positive impact on your business. Consider these key areas before combining one or more sets of data:
- Measurement & References: Make sure metrics across data sources actually refer to or measure the same thing.
- Data Collection: Consider how the data is being collected whether it’s being scanned or manually reported.
- Matching: Time periods, product definitions, market, category, and metrics definitions all must match to make appropriate conclusions.
- Direct Comparisons: Use both sources to make a direct comparison of any data point to see how well they match.
- Trending: Compare trends over time across sources to evaluate each source’s accuracy.
Integrating and appending Profitero data – we’ve got your back
When appending Profitero data to other data sources, know that we’ve got your back. We monitor, cleanse, analyze, and report on the brands, retailers, categories, and countries you care most about. This helps your team save time uncovering impactful insights.
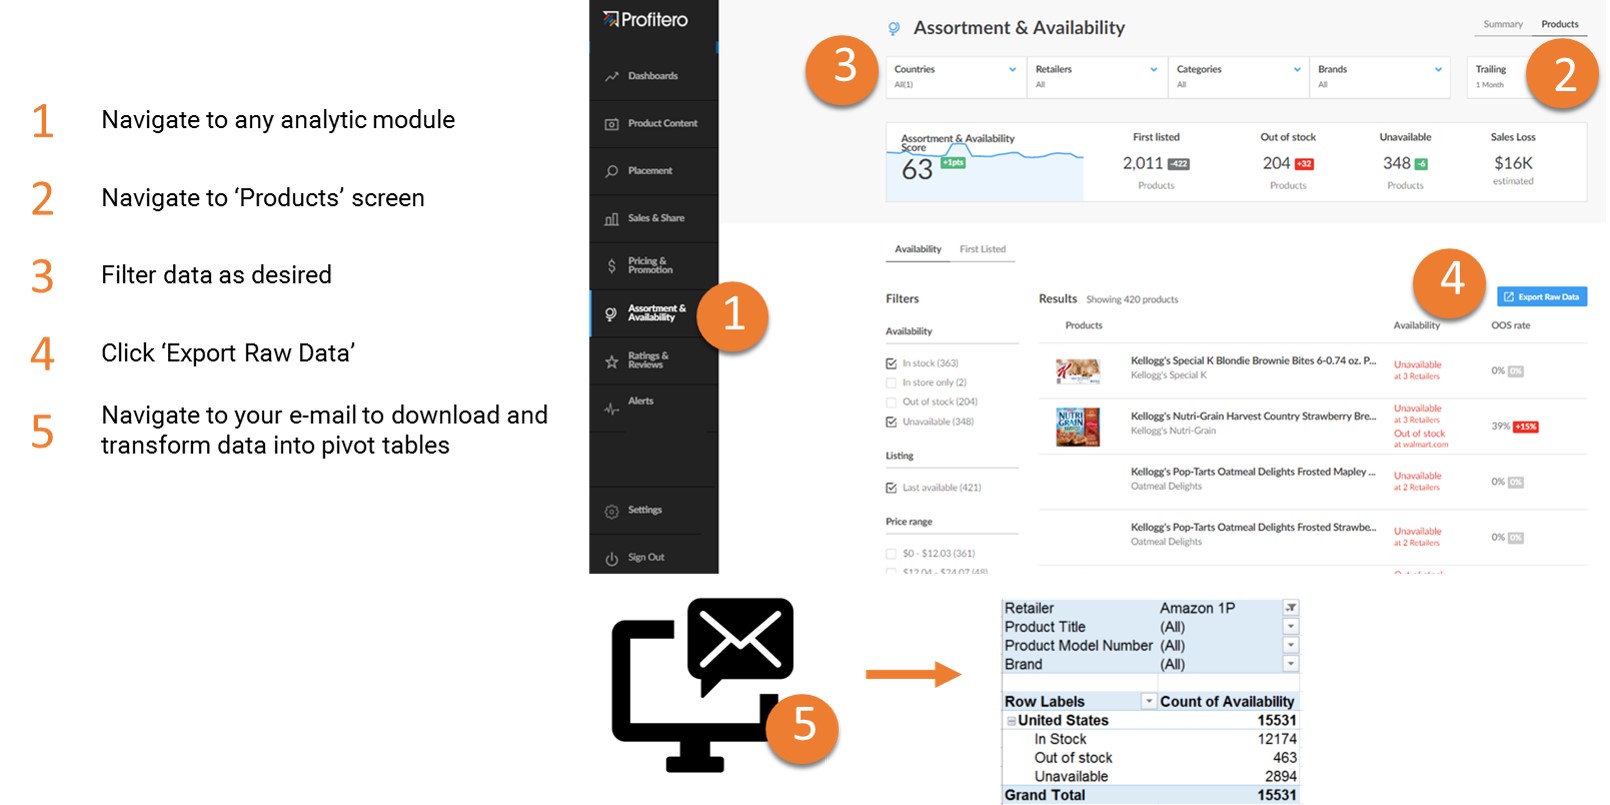
When exporting data from Profitero, you get powerful insights right in your inbox. Our reports:
- Can be filtered by countries, retailers, categories, brands and time period
- Can be filtered by any relevant side filters across each of our analytic modules, giving you precise control and access to just the right data
- Further, data is already mapped by Profitero to custom-defined and Amazon-defined category hierarchies
All of this makes analyzing Profitero data outside of the Digital Shelf 360 platform simple and intuitive and eliminates much – if not all – of the manual category mapping work many brands have historically been burdened with in-house.
For example, within the Amazon Sales and Share module, you can export key outputs such as 1P, 3P, and total sales in units or dollars (or relevant currencies) to append to other data sets. For Assortment and Availability, you can easily export retailer categories, data on when products were first listed, availability, and estimated sales loss (included with Sales & Share). That’s just scratching the surface, our customers can export data across every module in our Digital Shelf 360 platform.
Next Steps
For customers, log in now to export your data and get to work. Want to learn more about our powerful eCommerce analytics platform? Contact us. Or, if you’re just getting started with eCommerce performance, stay up-to-date with Profitero’s weekly Digital Shelf Digest.