


One of the advantages of syndicated store data is that it provides you with the most comprehensive retail sales picture you can obtain from a single source. But sometimes you can get greater insight and formulate more powerful arguments by enhancing your syndicated data with information from other sources.
Combining data sources can be tricky. Sometimes the translation and estimation required will outweigh the benefits. Sometimes the data blends so poorly it leads you to incorrect conclusions.
How do you avoid these trouble areas? In this post, originally published on CPG Data Tip Sheet, I’ll walk you through a checklist of questions to ask yourself before combining data sources. Then, I’ll give you an example of how I applied this checklist, enhancing a syndicated data ranking report with retailer POS data.
A Data Integration Checklist
When deciding whether to integrate multiple data sources, you should ask yourself some critical questions first—and a checklist is perfect for this. Start by considering where the data comes from:
- Do the data sources measure the same thing? And don’t just answer “yes they both measure sales”! Think more closely about what behavior is being measured.
- Is the data collected the same way? For example, is it passively scanned? Or manually reported? By whom? Where and how?
Then consider the four dimensions that underlie most CPG data:
- Do the time periods match?
- Do the product definitions match?
- Do the market definitions match?
- Do the metrics (and the way they are defined) match?
If things are still looking good, proceed to the final two questions:
- Can I make a direct comparison of any data points in both sources to see how well they match?
- Does the data trend the same way? (If one source shows sales going up and the other shows sales going down, that’s a red flag!)
The more you answer “yes” to these questions, the better you can feel about integrating the data and drawing conclusions. If some of your answers are “no,” that doesn’t mean you can’t combine the data, but you should be cautious. You should show your results side-by-side rather than merging the data or present conclusions as directional rather than firm.
A (Very) Simple Data Integration Example
Let me show you an example of how I applied this checklist for a client.
My client purchases syndicated data for their category but the data vendor’s category definition excludes some of my client’s products. This is not uncommon – often there are differences between the manufacturer, data vendor, and/or retailer view of the category definition. Unfortunately, the missing items were top sellers for a key retailer—so of course my client wanted to include those missing items in their presentation to that customer. What to do?
My client had two options for filling in the data for the missing items: POS data obtained directly from the retailer and internal shipment data. We started by applying the first two checklist questions—do the data sources measure the same thing and is the data collected the same way? On these two dimensions, retailer POS data was the obvious winner. Both retailer POS data and syndicated data measure consumer consumption (sales from retail stores) and they’re both gathered by POS scanners. In contrast, shipment data doesn’t match syndicated data on either dimension. It’s not measuring the same thing: shipments reflect what is sent to retailers, not what consumers buy from retailers. And the data is gathered a different way since shipment data is not collected via POS scanners.
Retailer POS data also did well on the four next checklist questions: time periods, products, market definitions and metrics. I could precisely match time periods, UPC level data was available in both sources, my syndicated data included all stores for this specific retailer, and I could get both dollars and units in both places. Bullseye!
So merging syndicated and retailer POS data was (theoretically, at least) very reasonable. But how well would it work in reality? To find out, I followed the final two checklist questions and pulled data from both sources to compare data points and look for trends.
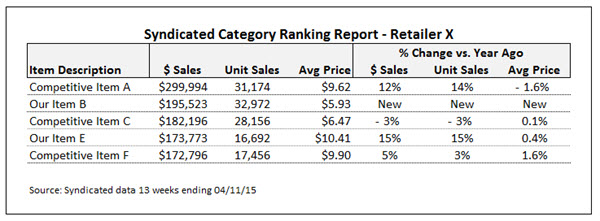
First, I took a look at the syndicated ranking report. Here’s a shortened, masked version of that report:
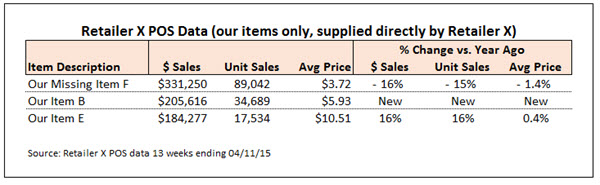
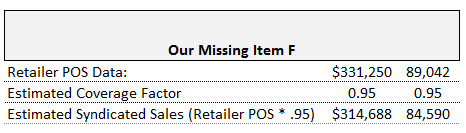
As is typical of retailer POS data, my client could only get data for their own items. Here’s how the retailer data looked for the items my client supplied:
Since two of my clients’ items (Our Item B and Our Item E) appeared in both reports, I was able to make a direct comparison between data sources, comparing absolute sales levels and also trends:
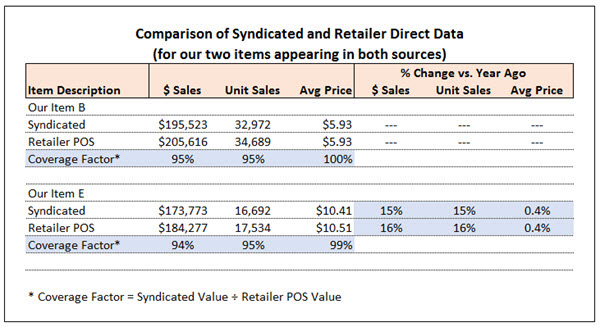
On average, in this case, my syndicated data was about 95% of the retailer POS data. In CPG data language, we would call that the “coverage factor”. Coverage factor is most commonly used when comparing shipments and consumption but it applies here as well. We’re looking at how well the syndicated data covers another, internally generated source of sales information.
The average retail prices lined up well between sources and so did the volume trends so everything looked good. Consequently, I added the missing item into my ranking report after reducing the POS volume by 5% (using the adjustment factor). In this case, I chose to adjust the retailer POS data down by 5% to match the syndicated data because the vast majority of the information in the report was syndicated. An alternative approach could have been to increase all the syndicated data by 5% to match the retailer POS data, since the POS numbers might be considered “right” and the gold standard by the retailer.
You may have noticed that coverage averaged slightly lower for dollars than units. Despite that, I stuck with an overall average adjustment for both measures rather than using 94.5% for dollars and 95% for units. In my opinion, if things are close, it’s better to keep things simple and consistent. Resist the urge to overthink or refine things too narrowly. When you start splitting hairs, it’s easy to get confused and/or confuse your audience.
I used the trend data (% change vs. year ago) and prices directly from the retailer POS with no adjustment. New average prices could have been recalculated from the adjusted dollar and adjusted units but that wouldn’t have changed their values in this case. I generally don’t adjust trends – I always feel that is moving in the direction of making up numbers.
Here’s the final ranking report I created, including the missing item. I was careful to explain what I had done and what assumptions I had used in a footnote.
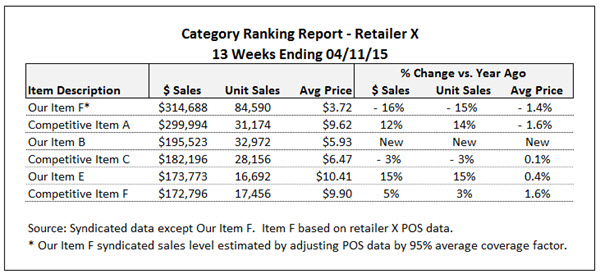
Was this report worth the effort? Absolutely! It turned out that the missing item ranked number one. The report also revealed that sales for this item had dropped—which gave us another area to investigate.
In this example, I integrated syndicated store data and retailer POS data. To read more about comparing syndicated store data and shipment data, check out Robin Simon’s post here. A third type of data commonly combined with syndicated store data is household panel data. Learn more about the differences between store data and panel data here. The checklist of questions introduced above will apply any time you combine syndicated data with these or any other data source.
Sally Martin is a hands-on marketing analyst and consultant with over 20 years experience turning data into insights. She provides freelance expertise to CPG companies, multi-channel marketers, and consulting organizations. Sally specializes in analysis of retail, panel, and customer order data.